
Building a RAG System That Generates Football Post-Match Tactical Reports Automatically
Transforming free event data from WhoScored and Fotmob into instant, comprehensive reports with LLMs for less than $0.50

Long time no see
First of all, Merry Christmas 🎄
It’s been a while since I last send a post, but life happens. So, here I am before finishing the year.
I wanted to end 2025 with the same vibe I want to start 2026: building projects and sharing knowledge.
Lately, I’ve been working on something that mixes my interest in AI and my passion for football. I’m really excited to go over its details and how the idea came up.
When I started analyzing football data and creating post match reports, I had a problem that I think a lot of coaches, analysts, and football data practitioners can relate to.
Gathering free match data from various sources to build reports is tedious.
This makes it difficult to create a summarized report from any match without hopping from one web to another.
Say if you want to analyze PSV’s pressing patterns from last week’s Eredivisie match day, you need to go to WhoScored, then Fotmob for shot and xG values, Understat, BeSoccer etc, and obtaining the data manually.
That’s why I wanted to built this system:
One where I could ask “What was PSV’s pressing strategy against Ajax?” in natural language and get an instant tactical report—with real stats, context, and visualizations from multiple free data sources.
I want to show you how it works.
What I Built
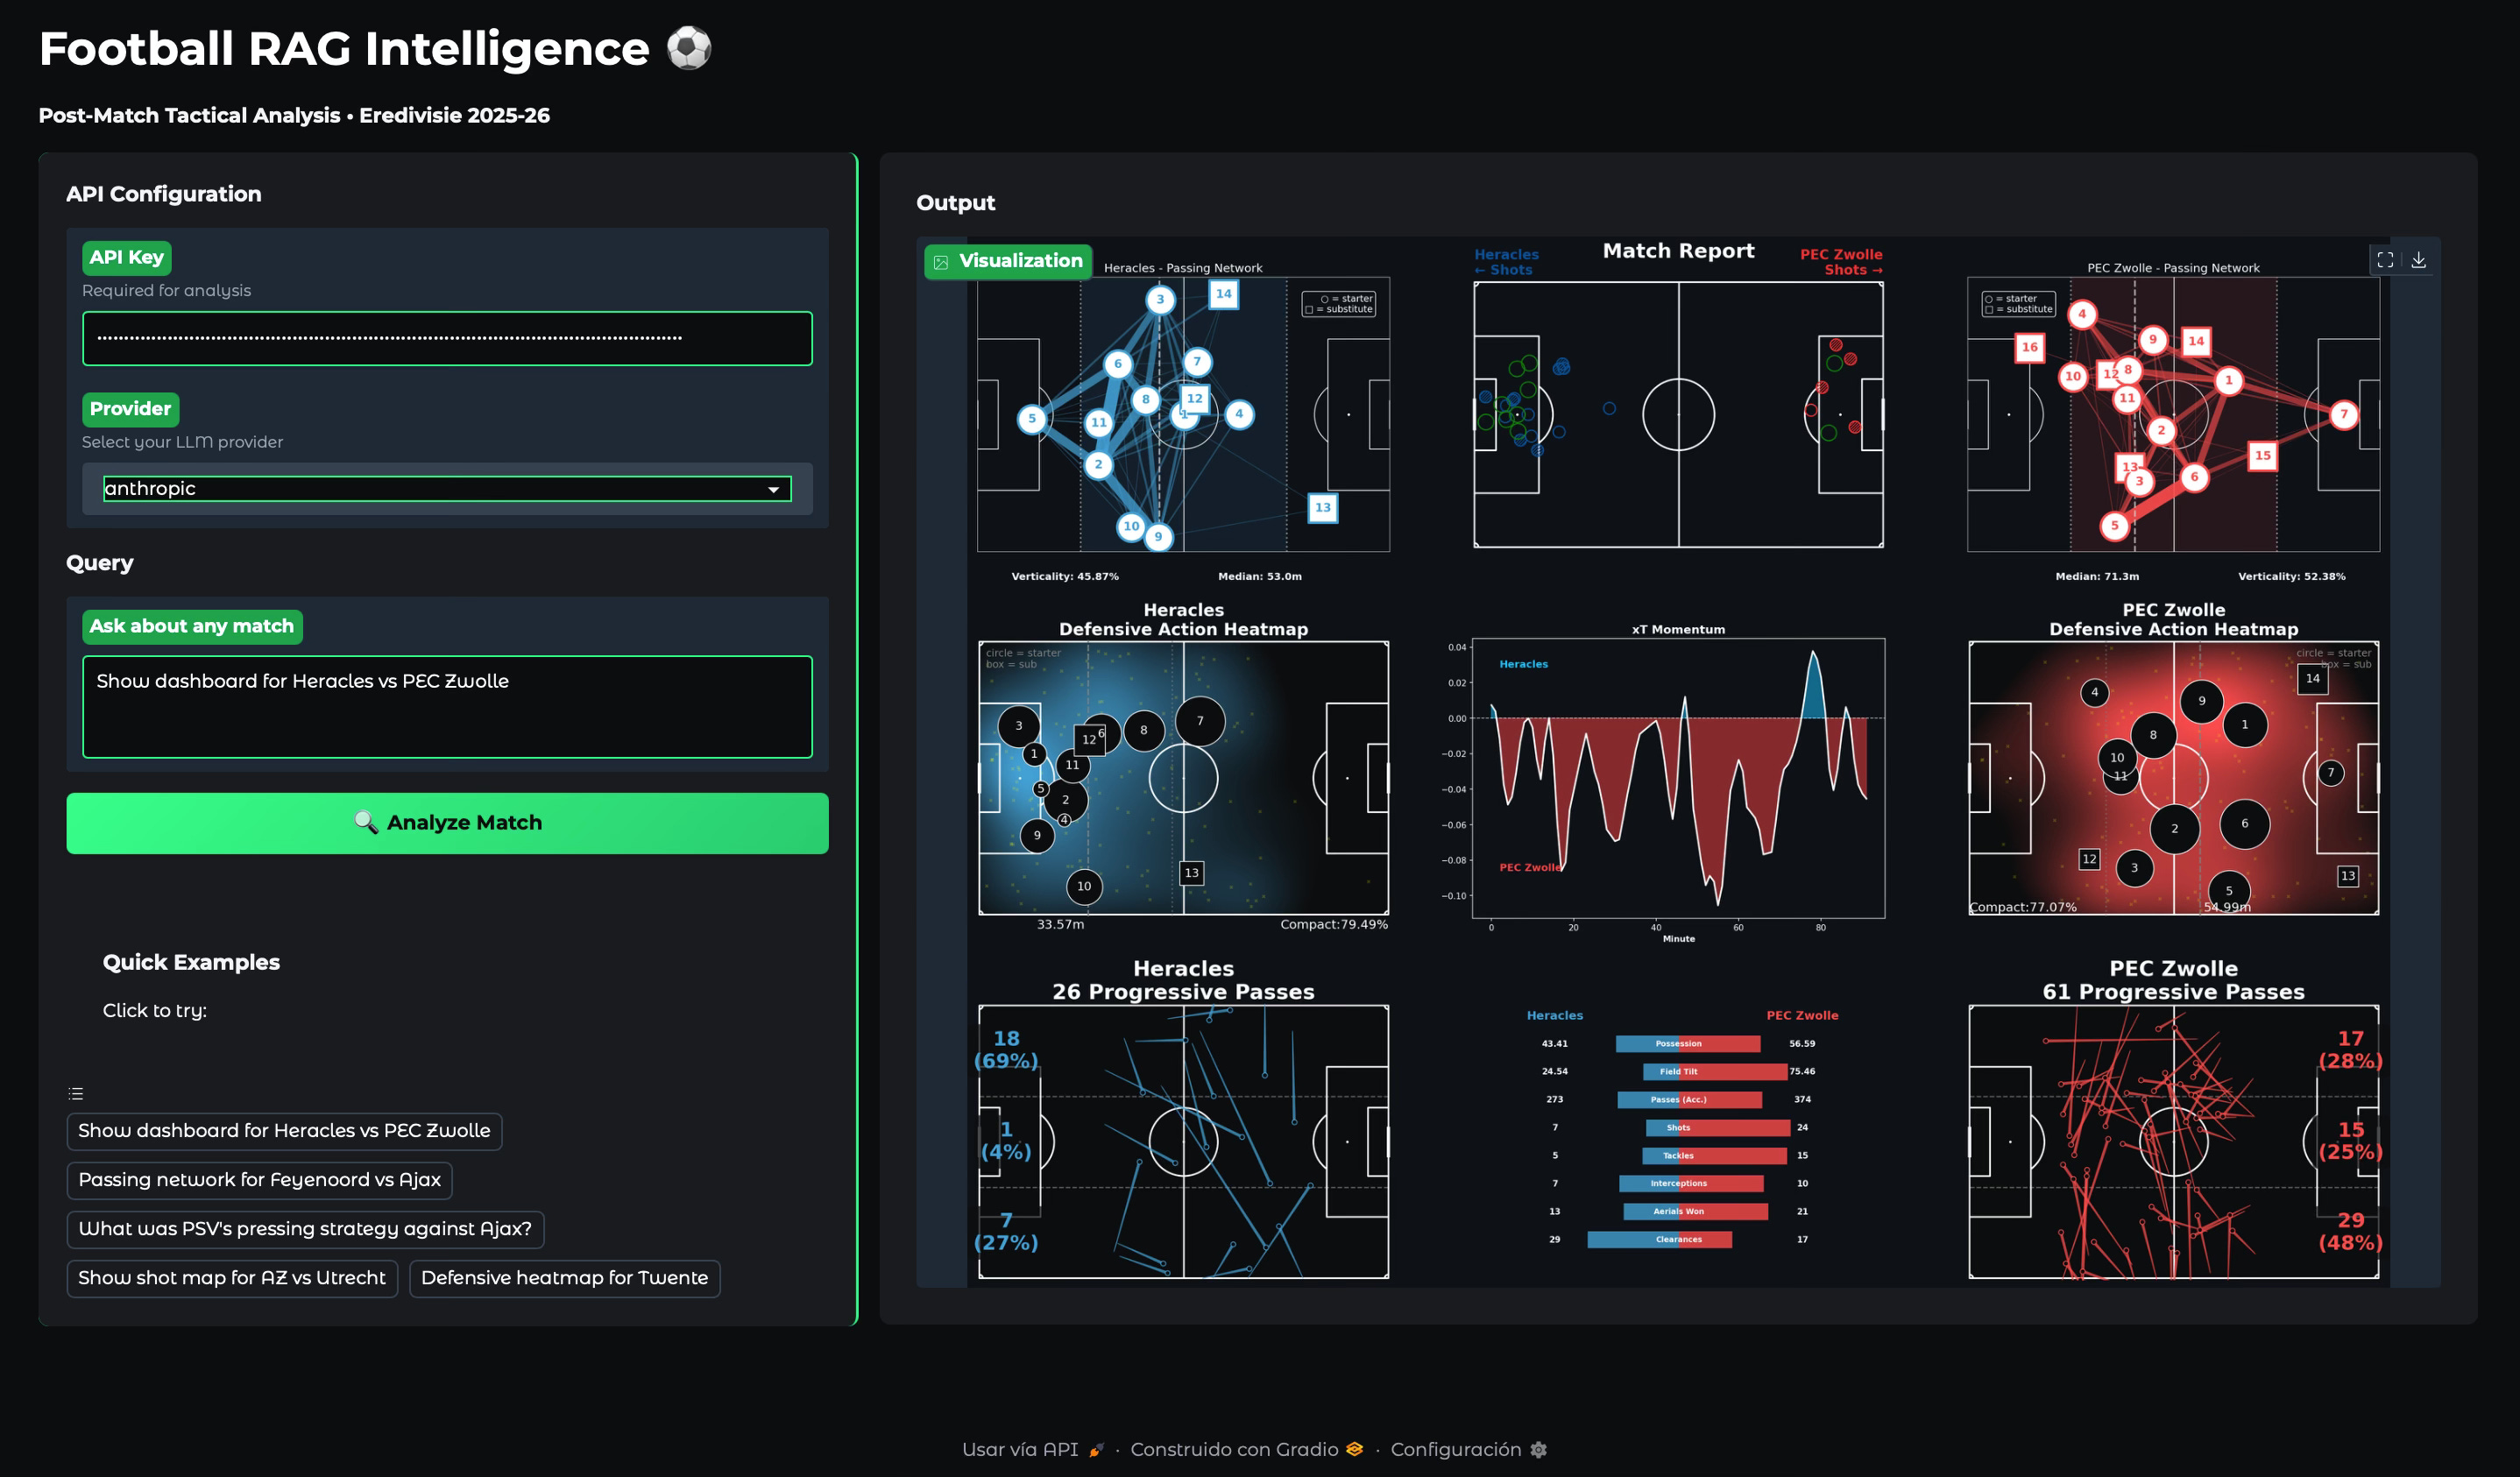
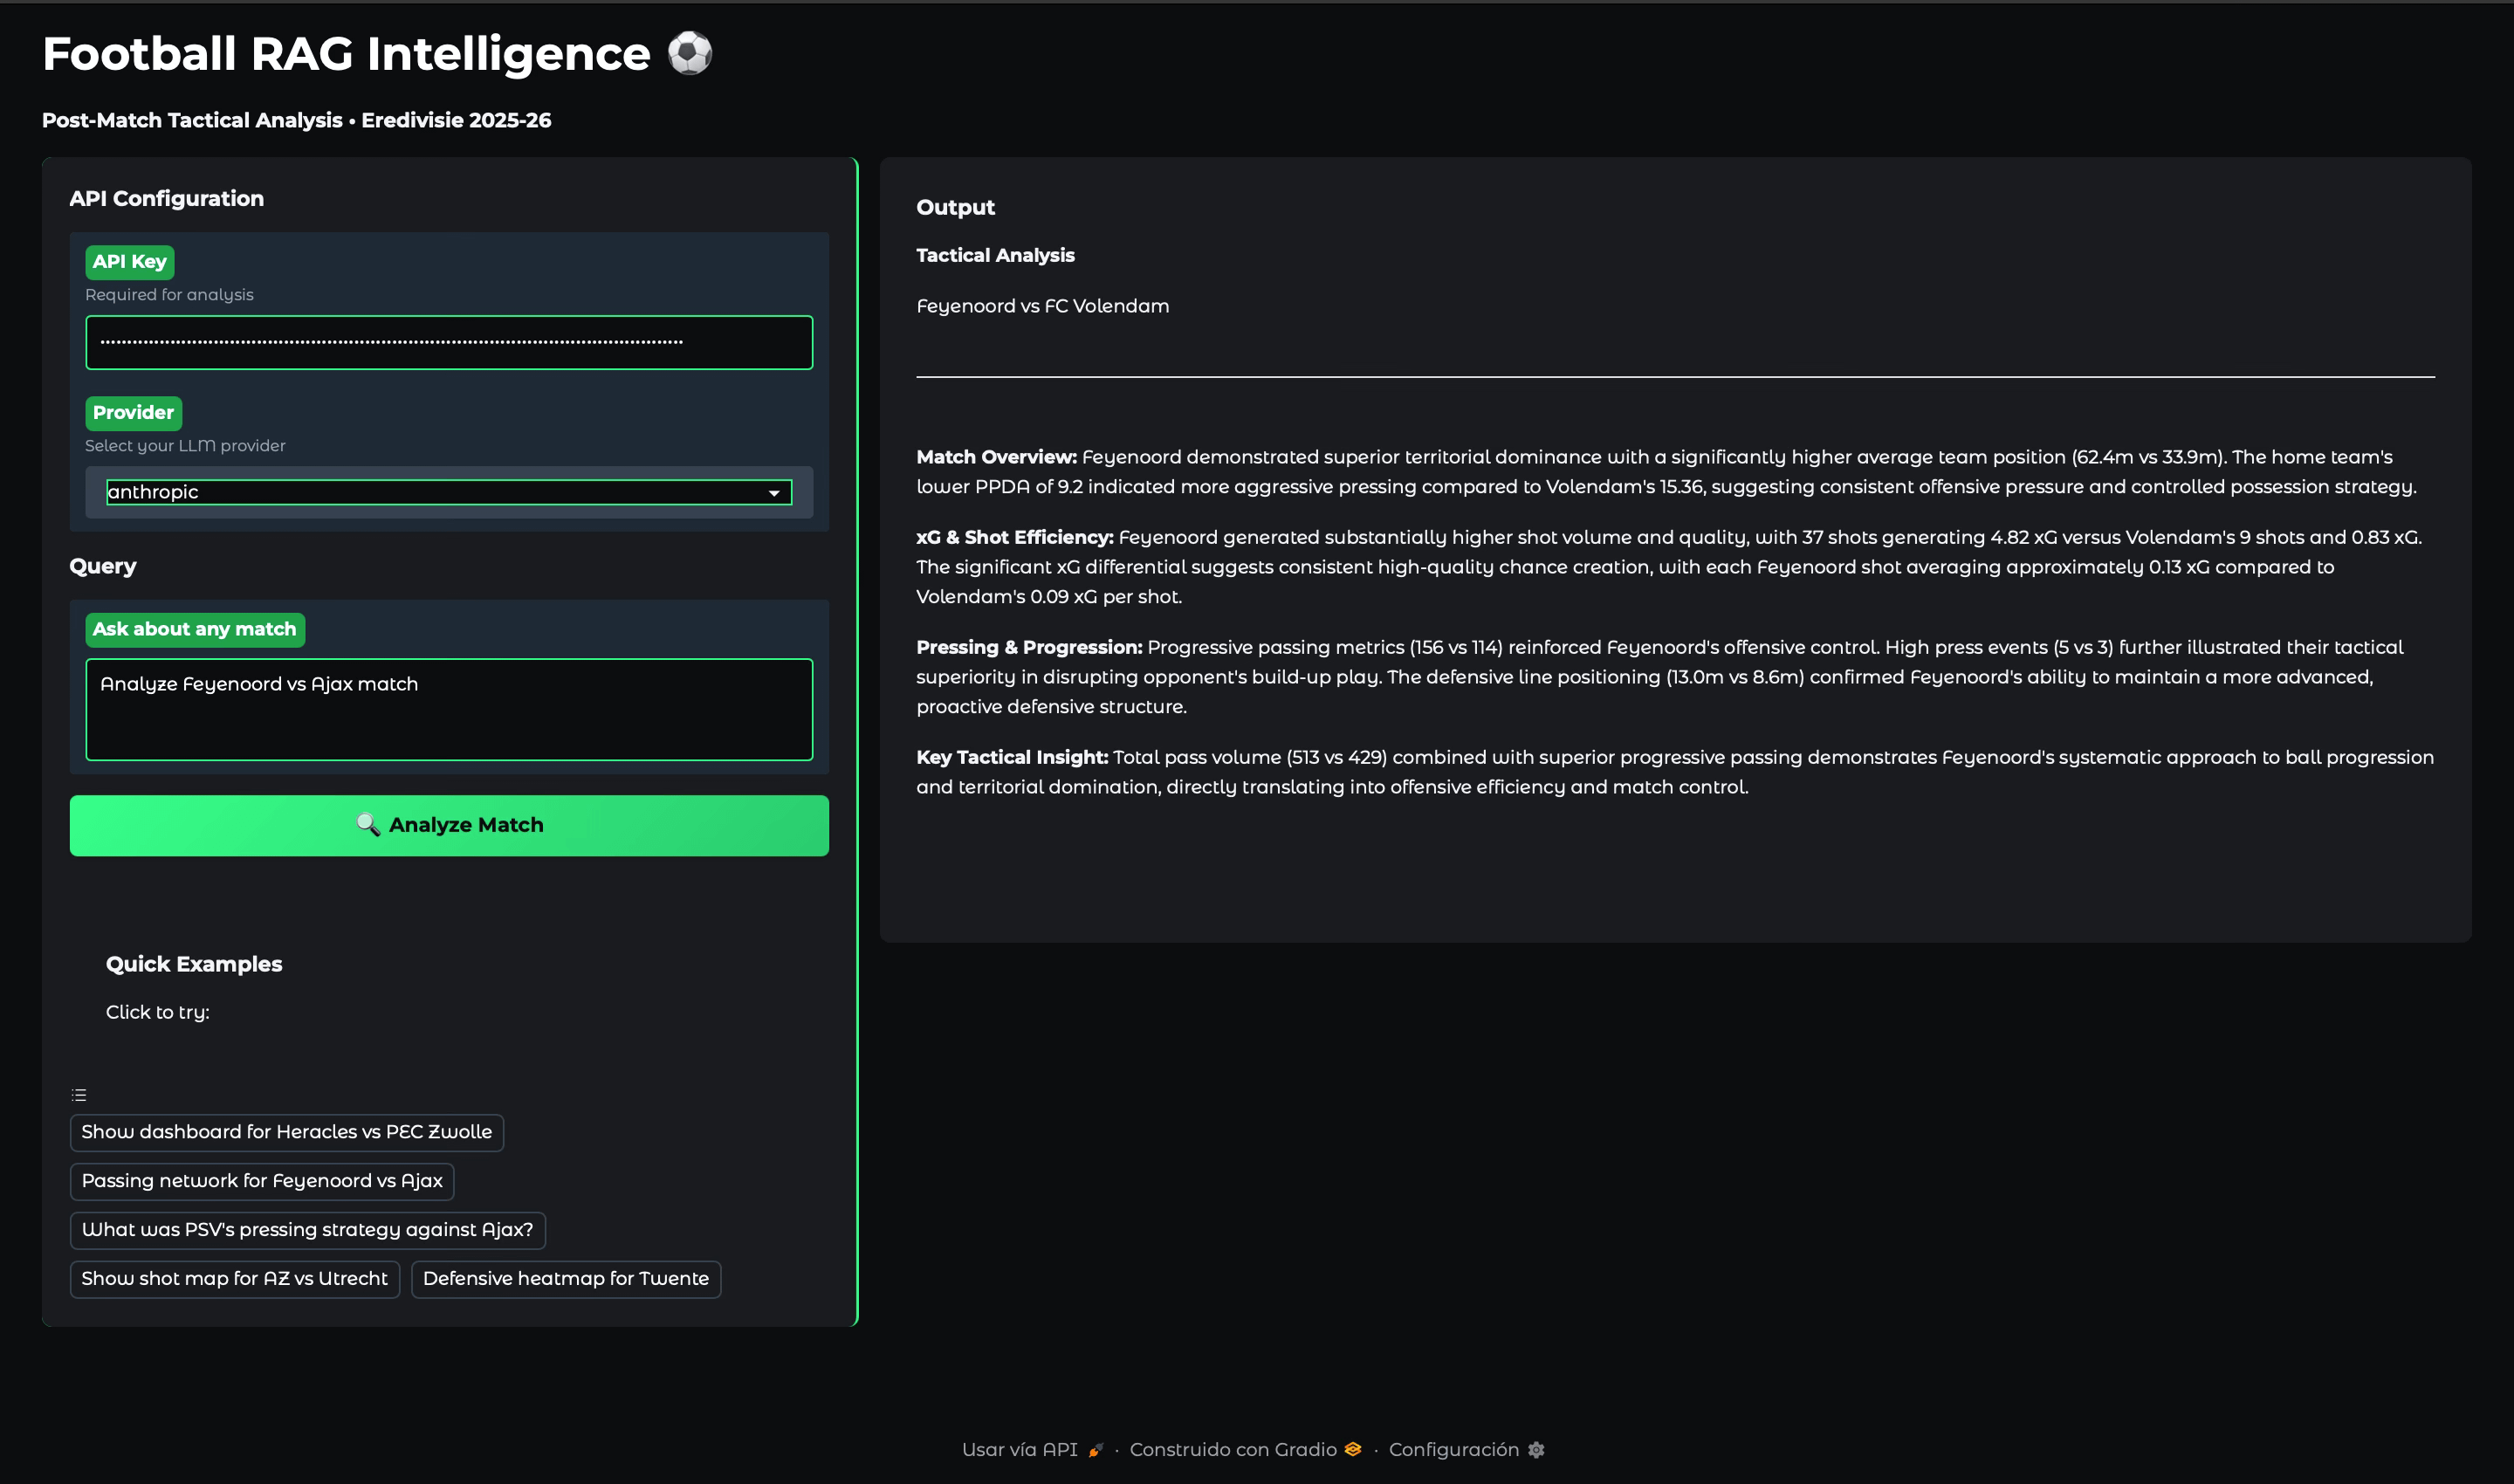
This is the live demo hosted at Hugging Face Spaces: Football RAG Intelligence - Live Demo
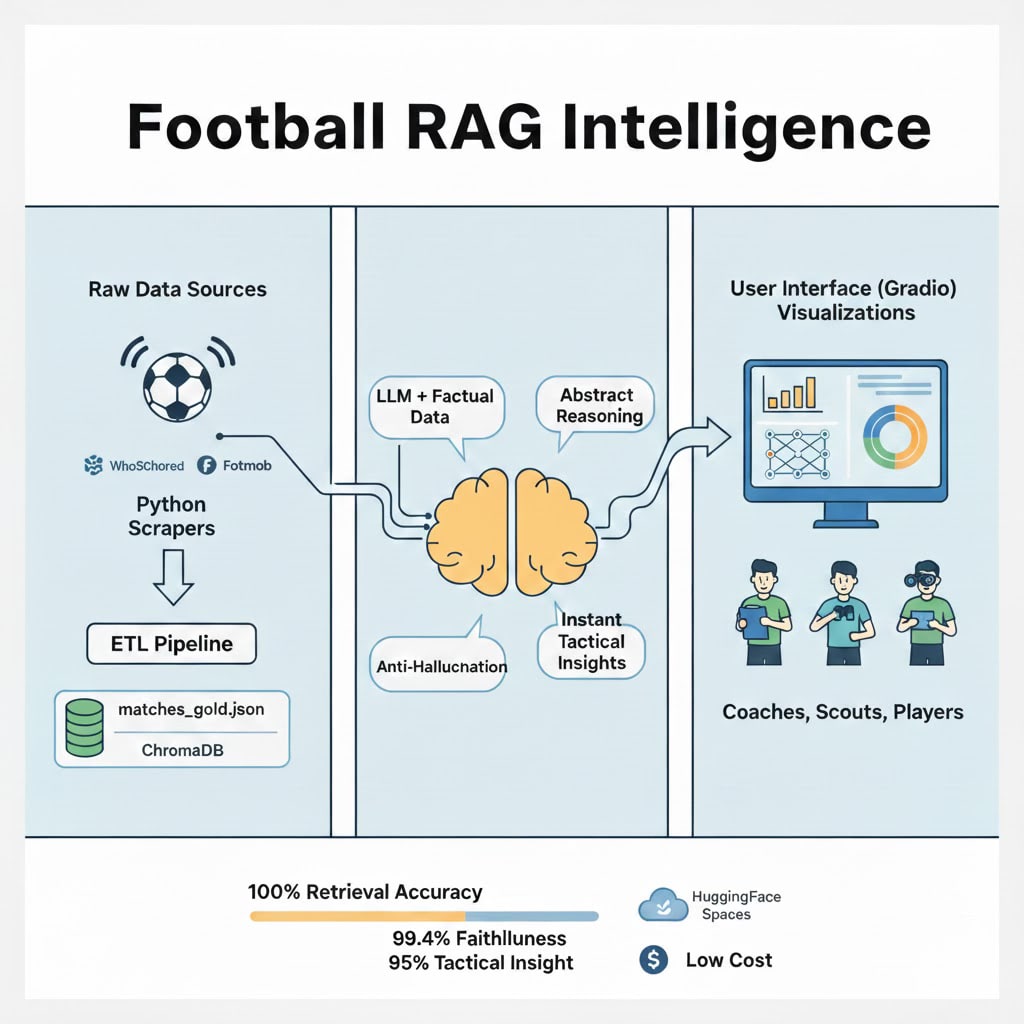
It’s a RAG (Retrieval-Augmented Generation) system that ingests Eredivisie match data from WhoScored and Fotmob, stores it in a vector database, and generates tactical analysis grounded in actual statistics.
You ask questions in natural language. It retrieves the match data and then generates comprehensive rundowns thanks to the LLM text-generation capability.
Reduced hallucinations and instant visualizations at low cost.
Here’s what it handles:
108 Eredivisie matches indexed with event-level data (~1355 events per match).
Dual-mode interface: Ask a question and get tactical commentary. Request a visualization and get instant plots.
Multi-provider support: Works with Anthropic’s Claude, OpenAI, and Gemini models.
$0.50 total cost to test everything.
The visualizations I used were already created using a prior code. I went through it in an earlier article, you can go check it here: Building Your Own Football Analytics Dashboards With Free Data
Why This Matters
Your match data lives in one place so you don’t have to hop around internet to get it. Ask questions in plain language, get answers backed by recent stats. Need a passing network or shot map? Type “show passing network for Feyenoord”.
Who can leverage this?
Coaches, scouts, and analysts at small/medium/big clubs, football fans, developers. Pretty much anyone involved in analyzing football with data.
How It Works
Here’s the high-level flow:
User Query → Router (classify intent)
             ↓
    ┌────────┴─────────┐
    ↓                  ↓
LLM Analysis      Visualization
(Tailored Prompt)     (Keyword-based)
    ↓                  ↓
ChromaDB          pre-built matplotlib
retrieval         plots
    ↓                  ↓
Grounded          $0 cost
Commentary        images
The system does five things:
1. Routes your query: Questions like “What was PSV’s pressing strategy?” go to the LLM pipeline. Commands like “Show shot map” trigger visualizations.
2. Retrieves match data: ChromaDB finds the exact match using team names and metadata filtering instead of semantic search guessing.
3. Generates analysis: The LLM gets the actual stats and writes tactical commentary using a carefully engineered prompt (which I’ll cover in Article 2).
4. Validates output: Every statistic cited in the response is checked against the golden dataset. If it’s not there, it doesn’t make it into the output.
5. Delivers instantly: Text analysis in 6-7 seconds or visualizations in under a second because they bypass the LLM entirely.
Hints on the key architectural decisions I made (I’ll dig deeper into these in future articles):
Prompt-first design: I designed the Tailored Prompt before building the ChromaDB schema. I wanted to tackle the mismatch between what the LLM expected and what the database provided.
2-chunk architecture: Each match gets two documents in ChromaDB. One summary chunk (team names, score, date) for filtering. One tactical metrics chunk (38 pre-calculated features) for LLM generation.
Pre-calculated metrics: All tactical metrics are computed during data ingestion. PPDA, progressive passes, field tilt, compactness, etc. The RAG pipeline doesn’t calculate anything, it just retrieves and interprets.
Smart routing: Text questions go to the LLM. Visualization commands go straight to the plots generation with matplotlib. This was to reduce the cost for every viz request.
Golden Dataset ETL: Raw data from WhoScored and Fotmob flows through a Pydantic validation pipeline. Only clean, validated data makes it into ChromaDB. This “airlock” pattern caught bugs before they could cause hallucinations.
The Results
In initial evaluation testing on 10 diverse matches, these were the obtained results:
Retrieval Accuracy: 100%
Every query found the correct match data. Metadata filtering (team names, dates) acts like a “sniper” approach versus pure semantic search, which only hit 70% accuracy.
Faithfulness: 99.4%
Generated analysis matched source statistics. Every number cited in the commentary exists in the golden dataset. One test case had a minor discrepancy due to rounding, hence 99.4% instead of 100%.
Tactical Insight: 95.0%
The commentary provided actual both tactical depth and data reporting.
I evaluated the system using an LLM-as-a-Judge methodology with specific rubrics and reference answers.
The cost: ~$0.0001 per query with Claude Haiku 4.5.
The system still occasionally generates erroneous team names or statistics, which is why continuous evaluation is important. I'll cover my evaluation approach in Article 4.
What’s Next: The Series Roadmap
This article gives a big picture of what I built and how it works.
In next articles I’ll go deeper into specific aspects of the journey:
Crafting a Football ETL Pipeline with free event data for RAG: What sources I used, why, how I managed all this data to make it useful for the system, and what is RAG.
Why Prompt Engineering Came before the vector database and how it helped optimize costs: Designing the Tailored Prompt to avoid retrieval-generation mismatch. I’ll show the many prompt iterations from V1.0 (1800 tokens, slow, vague) to V3.5 (360 tokens, fast, precise).
Evaluating the system with the Evaluation Driven Development approach: The LLM-as-a-Judge methodology. How I built the three-metric evaluation framework. Creating test datasets that actually matter. Debugging false failures.
Deploying the App: Hosting an initial version of the app in HF Spaces, a well-known place for AI/ML developers to deploy applications.
Next steps to Production Scaling: Current MVP limitations. Production stack design following data, software, and AI engineering best practices (CID/CD, pipeline orchestration, LLM cloud hosting and inference, automated evaluations) to go from proof-of-concept to a system that obtains weekly matches and generates fully automated reports on demand hosted on premise.
Try It Yourself
Demo Link: Football RAG Intelligence
Pick a provider (Claude, GPT, or Gemini), paste your API key, and start asking questions.
Example queries to try:
Text analysis:
“What was PSV’s pressing strategy against Ajax?”
“How did Heracles build up play against PEC Zwolle?”
“Explain the tactics in Feyenoord vs Ajax”
Visualizations:
“Show dashboard for Heracles vs PEC Zwolle”
“Show passing network for Feyenoord”
“Show shot map for AZ vs Utrecht”
The code is fully open source: GitHub Repository
Clone it.
Run it locally.
Modify it for your own league or data sources.
I included all the documented architecture decisions to showcase the entire process and next steps.
Bottom Line
The goal of this project is to show that:
A RAG system and an LLM of your choice fed by your own clean data, clear architecture, and careful prompt engineering, helps you solve a real problem like automated post match analysis.
Leveraging AI to create systems or tools is one of the things that excites me the most. There's something incredible about going from idea to working system so fast.
AI helps blur that line between "I want to build this" and "I built this."
I would love to hear some thoughts on this on how useful is this to you.
Til next time,
Ricardo.
I totaly feel this! RAG for football, so smart.